Home
Introduction to the Project
Welcome to the Temperature Anomalies Over Time Project!
Climate change is one of the most pressing issues facing our planet today. Understanding how our climate is changing and identifying trends in temperature anomalies are crucial steps in addressing this global challenge. Our project focuses on analyzing temperature anomalies over time, providing valuable insights into how our world is warming. By examining historical data from various regions worldwide, we aim to highlight significant trends and foster a deeper understanding of the impacts of climate change.
Stellar Data Visualization
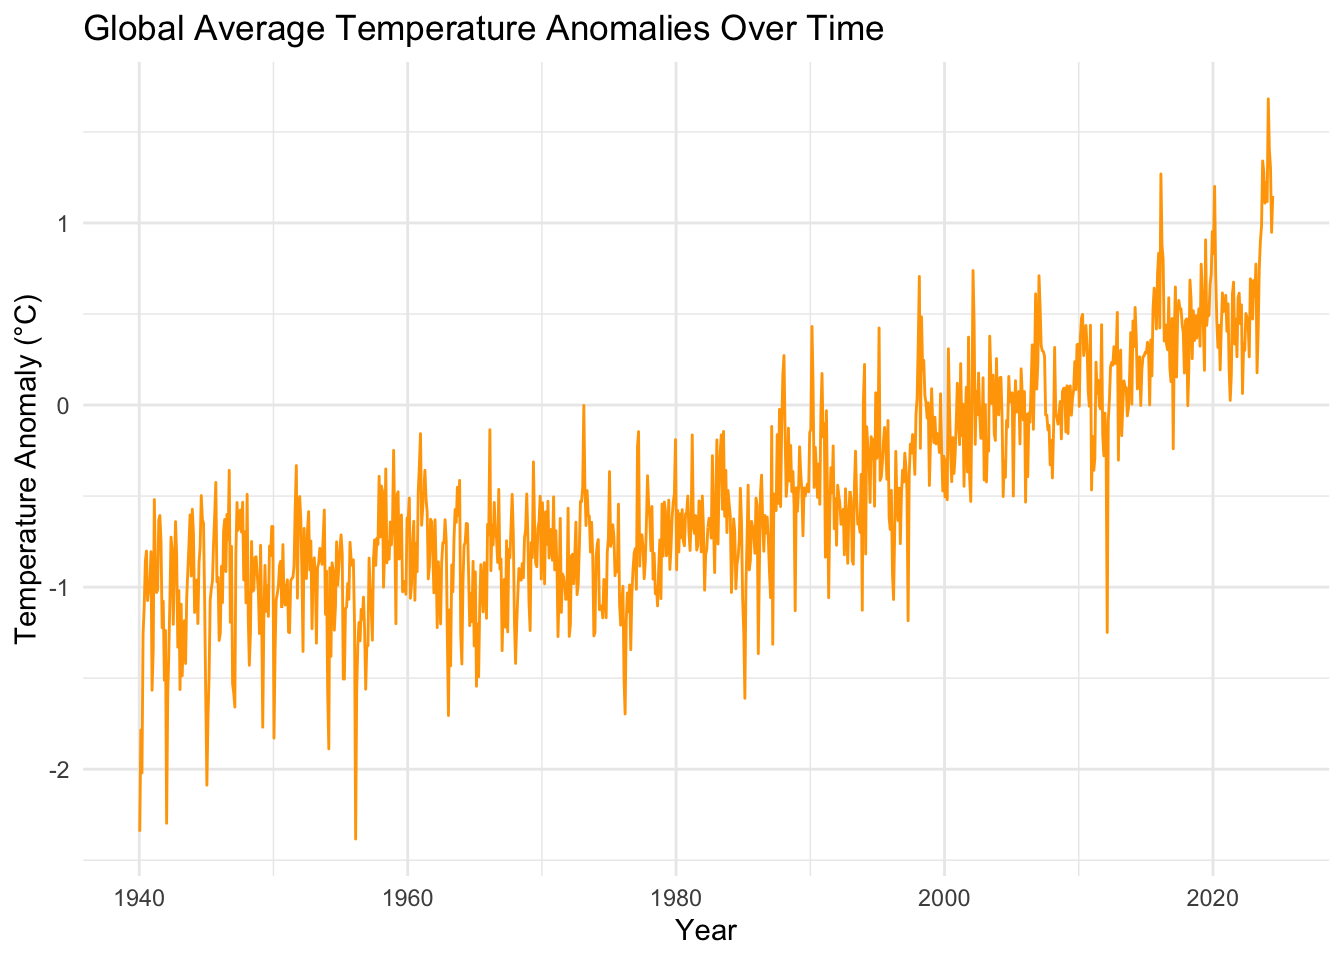
Global Average Temperature Anomalies Over Time
Visualize the historical changes in temperature anomalies with our interactive time series plot. Explore the data to see how global temperatures have deviated from long-term averages.
This visualization shows the average temperature anomalies across the globe from 1940 to the present. Each point represents the deviation from the long-term average temperature for a given month. The trend line highlights the overall warming pattern, illustrating the increase in temperature anomalies over the decades.
Inviting and Exciting Design
Our project is designed to be both informative and engaging. We use a clean, modern design with interactive elements to help you explore the data and understand the trends. Our visualizations are crafted to be clear and impactful, making complex data accessible to everyone. Whether you’re a climate scientist, a student, or simply someone interested in climate change, we invite you to dive into our project and discover the story that the data tells.